

Custom dashboards: templates, widgets and reports
A custom dashboard is a board of live widgets you lay out yourself — KPIs, charts and tables built on your event’s data, or on every event in the organization. Custom dashboards sit as tabs next to the built-in Today dashboard on an event and next to Overview on the organization Dashboard, and they run on the same reporting engine as the Report builder, so anything you can report on, you can put on a dashboard.
Video transcript
Every event opens on its Dashboard, and the Today tab is the one Sessionboard builds for you. The tabs after it are yours. This one, Program Health, is a custom dashboard, a board of live widgets on this event’s data, KPIs, a chart by day, a status mix. Same idea at the organization level, where the widgets read across every event. Anything you can report on, you can put on one of these, and that’s what I want to show you.
Add Dashboard. Three ways to start. The Gallery is pre-built templates, Event Overview, Submissions Pipeline, Speaker Tracking, Review Progress, Schedule Health, and sponsor and exhibitor boards when those modules are on. Each tile says what it covers and how many widgets you get, and one click creates the dashboard with them in place. AI prompt, describe what you want to track, or pick an example, and Sessionboard writes the widgets. Build manually, a name and a description, and you start from an empty board. I’ll close this, we’ve got one.
Add Widget, and the first tab is a gallery of ready-made widgets. Filter by area, sessions, speakers, submissions, evaluation, agenda, tasks and compliance, or search. Each card is a preview, what it shows, the module it draws on, and the visualization. Pick one and it’s on the board.
From report is the one I’d point you to first. Any custom report you’ve saved in this event is here. Choose it, choose how to show it, and this is the full list, table, KPI number, bar, stacked bar, pie, donut, line, area, radar, treemap, funnel, scatter, radial, progress bars, list, heatmap. Add linked widget, and it stays linked. Edit and save the report later, the widget follows.
Or build one from scratch. A name, a visualization, and the query three ways, the same three as the Report Builder. Describe it in plain English, or pick a suggested question. Build, pick the record type, columns and filters visually. Or SbQL, write the query yourself and run it to preview. Close that.
Hover any widget for its toolbar. Export, the widget’s rows as CSV or Excel. Run as report opens this query in the Report Builder, so a widget you like can become a full report you schedule and share. Edit widget. The name, the visualization, and the query it runs, with a PII Mode switch to mask personal details. And delete. Drag the handle to move a widget, the corner to resize, and the layout saves as you go.
It works from the other direction too. On the Reports page, every custom report card has an Actions menu, and Add to dashboard is in it. A widget name, a visualization, and which dashboard to put it on. Inside the Report Builder, the Widgets tab does the same for the report you have open. A dashboard holds up to twenty widgets.
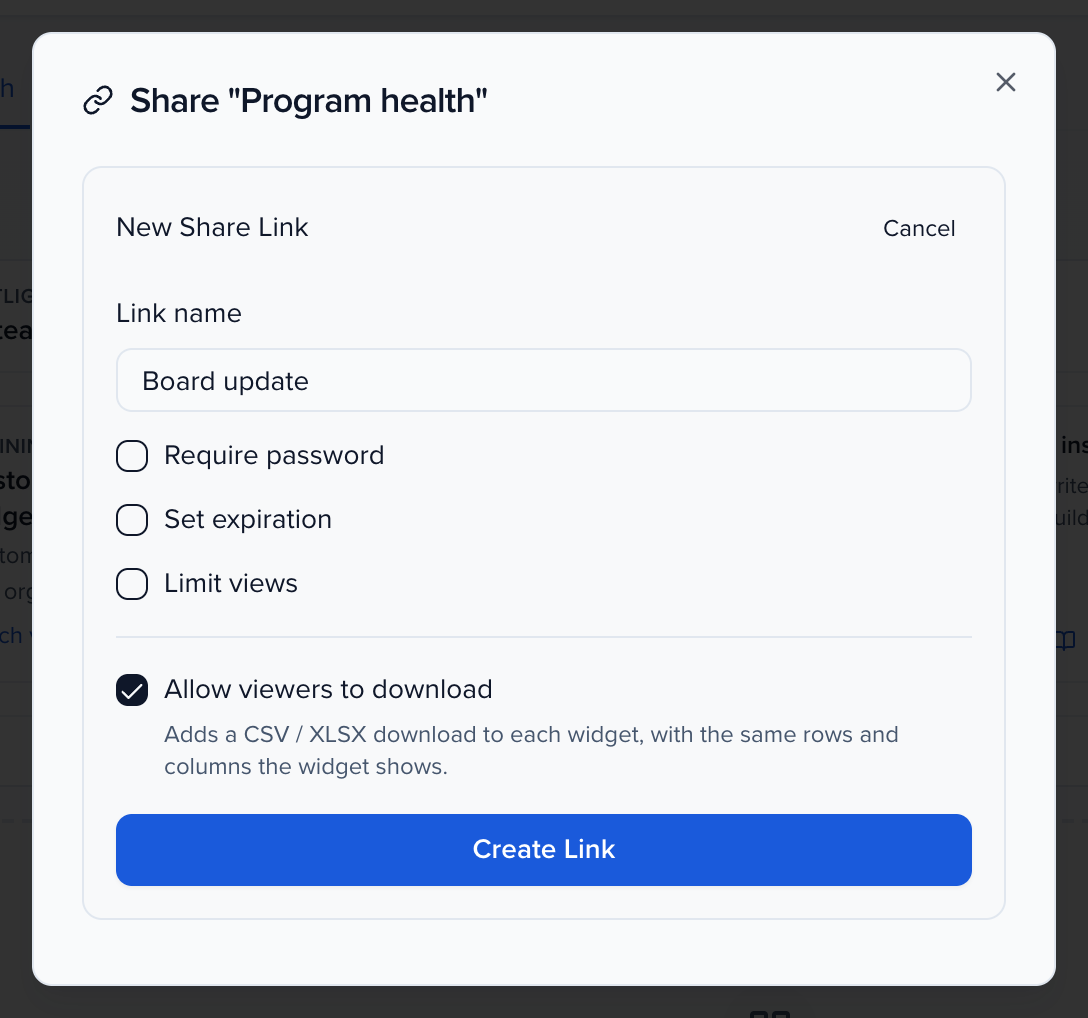
Settings, on the dashboard itself. Refresh re-runs every widget, Delete dashboard removes the board, and Share. Create New Link makes a public link that anyone can open without logging in, live data, not a snapshot. Give it a name, and if you need to, require a password, set an expiry, or limit the views. Existing links you copy or revoke from here. Cancel.
And at the organization. Dashboard in the sidebar, Overview is the built-in one, and after it your custom boards. This one reads across every event, total submissions, pending review, submissions by event, a status funnel. Same Add Widget, same Settings. And Add Dashboard has its own templates, Portfolio Overview, Cross-Event Pipeline, Speaker Portfolio, Review Across Events, Programs Overview, built for comparing events rather than running one.
So that’s custom dashboards. Start from a template or a prompt, add widgets from the gallery, from a saved report, or from a query you write, pick how each one looks, and share the board with a link. The Help Center has this under Reporting and Dashboards, Custom dashboards, and the Report Builder article covers the query side.
Why use it
Section titled “Why use it”Dashboard shares give external viewers — clients, sponsors, leadership — a live window into your event data without requiring a Sessionboard login. When you enable downloads on a share link, those viewers can pull the exact rows a widget shows into a spreadsheet, formatted with your event’s date and time settings. Password protection, PII masking, and per-link revocation all apply equally to downloads and views, so you stay in control of what leaves the platform.
Where dashboards live
Section titled “Where dashboards live”- Event level — open an event’s Dashboard. Every custom dashboard is a tab after Today, and Add Dashboard on the right starts a new one. Widgets are scoped to that event.
- Organization level — open Dashboard in the organization sidebar. Custom dashboards are tabs after Overview; the same Add Dashboard button is on the right. Widgets here read across all of the organization’s events, so this is where you compare events, follow a pipeline over the year or watch a speaker pool.
The selected tab is kept in the page URL, so a link to a dashboard opens on that dashboard.
Above the widgets, a Custom dashboard label and the description you gave it sit on the left, and Add Widget and Settings on the right.
Create a dashboard
Section titled “Create a dashboard”Click Add Dashboard. The New Dashboard dialog opens with three ways to start: Gallery, AI prompt and Build manually.
Pick a starting point:
- Gallery — pre-built dashboards, one tile each, with a preview, a short description, the area it covers and how many widgets it holds. Click a tile and the dashboard is created and opened with its widgets already in place.
- AI prompt — describe what you want to track in What do you want to track?, or pick one of the example prompts, then click Generate dashboard. Sessionboard writes the widgets for you.
- Build manually — give the dashboard a Dashboard name and an optional Description, click Create dashboard, and start from an empty board.
Add, edit and rearrange widgets. Drag a widget by its handle to move it, and drag the corner to resize it. The layout saves as you go.
Templates in the gallery
Section titled “Templates in the gallery”The gallery depends on where you are and on which modules your event or organization uses — a sponsor template only appears when Sponsors is on, for example.
| Scope | Templates |
|---|---|
| Event | Event Overview, Submissions Pipeline, Speaker Tracking, Review Progress, Evaluation Plans by Tracks, Schedule Health, Sponsor Performance, Exhibitor Performance |
| Organization | Portfolio Overview, Cross-Event Pipeline, Speaker Portfolio, Review Across Events, Programs Overview, Partner Performance |
Each template creates four or five widgets — a few KPI numbers and a couple of charts or tables. Nothing about a template is fixed once it is on the board: rename, re-query or delete any widget, and add your own.
Add a widget
Section titled “Add a widget”Click Add Widget. The Add Widget dialog has three tabs.
Gallery
Section titled “Gallery”A catalog of ready-made widgets, each with a preview, a one-line description, the module it draws on and its visualization. Filter by area with the chips under the search box — Sessions, Speakers, Submissions, Evaluation, Agenda, Tasks & Compliance, Sponsors and Exhibitors on an event; Sessions, Speakers, Submissions, Evaluation, Programs and Portfolio on the organization — or search by name. Click a widget to add it.
From report
Section titled “From report”Turn a saved custom report into a widget that stays linked to it.
- Choose the report under Report — every custom report saved in this event (or, on an organization dashboard, at the organization level) is listed, and the search box narrows it.
- Pick a Visualization type.
- Click Add linked widget.
A linked widget runs the report’s query, so when you edit and save the report, the widget follows. In the widget’s editor the query is shown as Linked to report and cannot be changed; Open report takes you to it. Edit query anyway unlinks the widget so it keeps its own copy of the query — the report itself is not affected.
The same link can be made from the other direction: on the Reports page, a custom report’s Actions menu has Add to dashboard, which asks for a Widget name, a Visualization type and the Dashboard to put it on. Inside the Report builder, the Widgets tab does the same for the report you have open.
Build custom
Section titled “Build custom”Write the widget yourself. Give it a Widget name, choose a Visualization type, then build the query in one of three ways — the same three the Report builder offers:
- Describe it — type what you want in plain English, or pick one of the suggested questions, and click Generate Report. You can attach a sample spreadsheet with Attach sample report (CSV or XLSX) to show the shape you are after.
- Build — pick the record type, columns, filters and grouping visually. A filter on an option field, such as track, status, a tag or a custom dropdown, offers the event’s own values in a dropdown (or a multi-select for IN and NOT IN) instead of a text box; see Filters.
- SbQL — write the query directly. Run previews the results; Schema opens the field reference.
PII Mode masks personal details in the widget’s output, the same way Hide personal details does on a report.
Visualization types
Section titled “Visualization types”Every widget has a visualization, chosen when you add it and changeable from Edit widget:
| Visualization | Best for |
|---|---|
| Table | Data in rows and columns |
| Number / KPI | A single metric |
| Bar Chart, Stacked Bar | Comparing categories, with or without segments |
| Pie Chart, Donut Chart | A proportional breakdown |
| Line Chart, Area Chart, Stacked Area | Trends over time |
| Radar | Comparing several measures at once |
| Treemap | Nested proportions |
| Funnel | Stage-by-stage flow, such as a submission pipeline |
| Scatter Plot | Correlation between two values |
| Radial Bar, Progress Bars | Progress against a total |
| List | A simple ranked list |
| Heatmap | A color-coded grid |
A dashboard holds up to 20 widgets. At the cap, adding is disabled with the message Maximum of 20 widgets per dashboard until you remove one. To track more, create another dashboard for the rest. Module tables have a separate column limit, covered in Module table views.
Work with a widget
Section titled “Work with a widget”Hover a widget for its toolbar:
- Export — download the widget’s rows as Export .CSV or Export .XLSX.
- Run as report — open the widget’s query in the Report builder to reshape, save, schedule or share it as a full report. On a linked widget this is Run linked report.
- Edit widget — rename it, change the visualization or rework the query.
- Delete widget — remove it from the board.
Widgets compute when the dashboard opens. Settings > Refresh re-runs every widget on the board.
Share a dashboard
Section titled “Share a dashboard”Settings > Share opens Share for the dashboard. Create New Link makes a public link that anyone can open without a Sessionboard login — give it a Link name, and optionally Require password, Set expiration or Limit views. Existing links can be copied or revoked from the same dialog, and revoked links stay listed under Revoked links. Shared dashboards show live data.
A share link is view-only unless Allow viewers to download is on for it. Tick Allow viewers to download in the Create New Link form, or switch it on or off later with the same checkbox on the link’s row in Share. It is off by default on new links and on every link created before the option existed. With it on, each widget on the shared dashboard that has data gets a Download menu with Download .CSV and Download .XLSX, and the file holds the same rows the widget shows — the same PII setting, date and time format and 500-row cap — named after the widget. A password-protected link asks for the password before anything downloads, every download is recorded in the link’s access log, and turning the setting off or revoking the link stops downloads at once. Links show a Downloads badge in the dialog while it is on.
Delete a dashboard
Section titled “Delete a dashboard”Settings > Delete dashboard removes the dashboard and its widgets. Reports that widgets were linked to are not deleted.
Permissions
Section titled “Permissions”Organization members can open, build and edit dashboards at both levels. On an event, users who are not organization members need the event role’s Reports permissions — view reports to open dashboards, create reports to add and edit widgets. The dashboard rows on a role — Can view dashboards, Can add dashboards, Can update dashboards and Can delete dashboards — are under Data & Insights. See Invite and manage event team members.
Related
Section titled “Related”- Report builder — the query engine behind every widget
- Custom reports — saving, scheduling and sharing reports
- Event Dashboard — the built-in Today dashboard