
🔒This feature requires activation. Insights is not enabled by default. To turn it on for your account, contact us at support@sessionboard.com.

- Custom Reports
- Report Builder: Three Ways to Create a Report
- Running a Report & Exploring Results
- Saving a Report
- Session Reports (Pre-Built Templates)
- Custom Reports
- Sharing a Report
- Scheduling Automated Report Deliveries
- PII Mode
- Schema Explorer
- Permissions & Access
- FAQ & Troubleshooting
Custom Reports
In addition to pre-built reports, Sessionboard's Reports section supports Custom Reports, tailored queries that let you monitor specific metrics across your event.
To create a custom report, go to Reports from the left sidebar and click + Add Report.

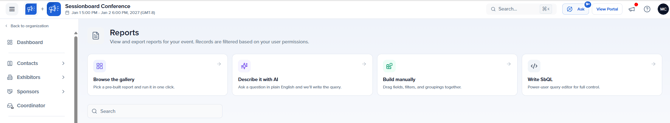
Report Builder: Three Ways to Create a Report
The Report Builder sits at the top of the Reports page. It gives you three different approaches to building a query, so you can work at whatever level of detail you need.
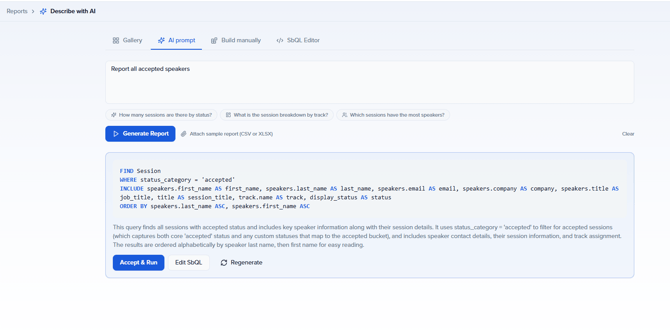
1. Describe It — AI-Powered
Type your question in plain English — for example, "Report all accepted speakers" — and click Generate Report. The AI automatically writes the SbQL query and shows you a preview with a plain-language explanation before anything runs.
You can also click any of the quick suggestion chips below the text field to start from a common question, such as:
- Which sessions have the highest average evaluation scores?
- What are the most popular session tracks?
- Which sessions have the most speakers?
- What are the top tasks that need to be completed before the event?
Once the AI generates a query, you have three options: Accept & Run, Edit SbQL, or Regenerate.
AI Anomaly & Pattern Detection
Beyond answering direct questions, the AI can also surface anomalies and patterns you may not have considered, such as unusually high bounce rates, sessions with no assigned speakers, or evaluation score distributions that stand out. Use natural-language prompts, such as "Are there any patterns in session submissions I should know about?" to proactively explore your data.
2. Builder — No Code Required
Switch to the Builder tab to build your report visually. Select the module you want to query (Sessions, Contacts, Evaluations, etc.), then configure:
- Columns — choose which fields to include in the output
- Filters — narrow results by specific conditions
- Group By — aggregate data by a field
- Sort By — control the order of results

3. SbQL Editor — Advanced
The SbQL Editor (Sessionboard Query Language) lets you write queries directly in code. It's designed for advanced users who need precise control over complex reports. Use the Schema Explorer as a reference for all available fields and objects.

Running a Report & Exploring Results
Click Run to execute the active query. Results appear in a table below the builder, along with tools to navigate and organize the data.
[Navigating Results
- Search results: filter the displayed rows without modifying the query
- Group by: group rows by any available field to analyze data by category
- Pagination: move between pages using the controls in the top-right corner — row count and query execution time are shown at the bottom
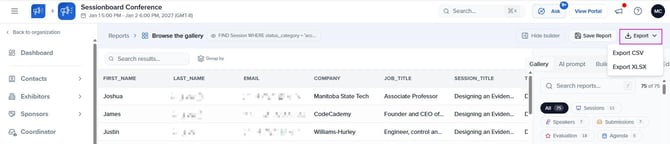
Exporting Results
Click the Export button to download the data:
- Export CSV — comma-separated text file
- Export XLSX — Excel spreadsheet
Saving a Report
Once you've run a query and are happy with the results, save it so you can reuse or share it later.
- Click Save Report in the results toolbar.
- Enter a descriptive Report Name (e.g., "Accepted Speakers by Track").
- Optionally add a Description to explain what the report shows.
- Click Save Report to confirm.

The saved report will appear under Custom Reports on the main Reports page.
Session Reports (Pre-Built Templates)
Session Reports are ready-made reports included with every event. They cover the most common data needs so you don't have to build them from scratch.
Examples include:
- Sessions with Speaker Details
- Sessions with Evaluation Ratings
- New Sessions Report
To run one, click Run Report on any card. Results load instantly and can be exported or shared just like a custom report.

Custom Reports
Custom Reports are any reports you've saved yourself. They appear in their own section on the Reports page and can be managed, shared, duplicated, or scheduled at any time.

💡 Tip: Want to learn how to create custom reports? See Create Custom Reports.
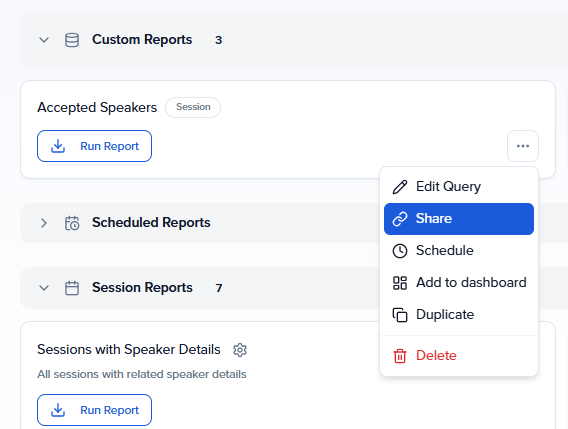
Managing a Custom Report
Click the ... on any custom report card to access:
- Edit Query — reopen in the Report Builder to make changes
- Share — generate a shareable link (see Section 7)
- Schedule — set up automated email delivery (see Section 8)
- Duplicate — create a copy to use as a starting point
- Delete — permanently remove the report
Sharing a Report
Share a report with anyone — even people without a Sessionboard account — using a secure link. Shared links always show live data, not a static snapshot.
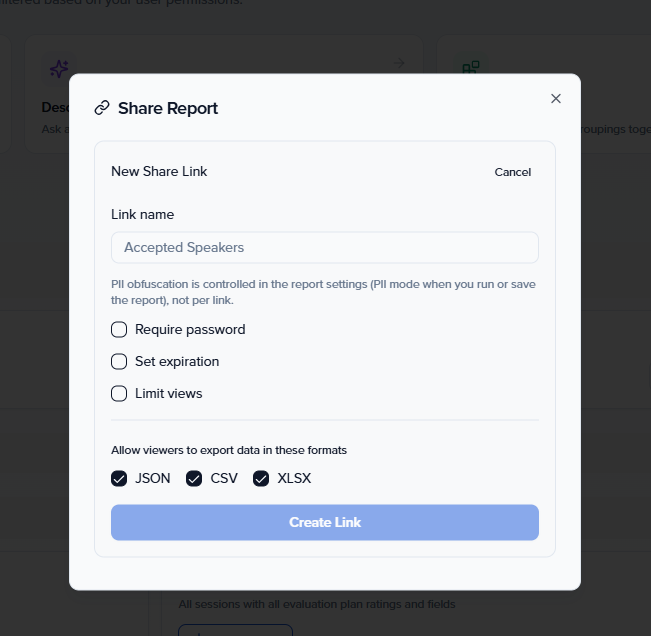
Creating a Share Link
- Open the ... menu on the report card and select Share.
- Click + Create New Link.
- Give the link a name so you can identify it later.
- Optionally configure access restrictions:
- Require password — recipients must enter a password to view
- Set expiration — the link stops working after a chosen date
- Limit views — restrict the number of times the link can be opened
- Click Create Link.
Using the Share Link
Each link exposes multiple formats you can copy and use directly:
- Shareable Public Link — view the report in a browser
- CSV Link — direct URL that downloads the report as CSV
- Google Sheets Formula — paste the
=IMPORTDATA()formula into Google Sheets to pull live data automatically - JSON Link — for developers integrating report data into other tools
- XLSX Link — direct URL that downloads the report as Excel
You can create multiple links per report — for example, one public link and one password-protected link for internal use. The view count for each link is shown next to its name.
Scheduling Automated Report Deliveries
Set up a schedule to have any report emailed automatically to your team on a regular basis — no manual work required.
Creating a Schedule
- Open the ... menu on the report card and select Schedule.
- Enter a Schedule Name (e.g., "Weekly Speaker Status Update").
- Set the Frequency: Daily, Weekly, or Monthly.
- For weekly schedules, select the day(s) of the week to send.
- Set the Time and Timezone for delivery.
- Add up to 5 recipients by entering their email addresses.
- Optionally write a Custom message to include in the email body.
- Click Create Schedule.

📌 Note: Recipients receive an email with a secure link to view the report. The link expires after 7 days and shows live data, not a static export.
💡 Tip: Scheduled reports appear in the Scheduled Reports section of the Reports page, where you can view, edit, or delete them at any time.
PII Mode
PII Mode (Personally Identifiable Information) lets you run and review a report while keeping sensitive contact data — like names and email addresses — hidden from view. This is useful when sharing your screen or working in environments where data privacy is a concern.
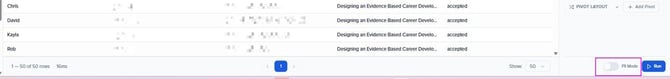
How to Enable
Toggle the PII Mode switch in the bottom-right corner of the results view. When active, personal data fields are masked in the results table.
Schema Explorer
The Schema Explorer is a reference panel that lists all available objects and fields in your event data. It's especially useful when writing SbQL queries manually, but it's also helpful for understanding what data Sessionboard tracks across modules.
How to Access
Click the Schema button in the bottom right-hand corner of the Report Builder. The Schema Explorer opens as a side panel where you can browse objects and their available fields.

Permissions & Access
Access to Insights is controlled at both the organization and event level through the Permissions system.

To manage permissions, go to Event Team → Permissions and select the relevant role. Under the Data & Insights section, configure:
- Can view reports — view and run existing reports
- Can create reports — build and save new custom reports
- Can share reports — generate shareable links
- Can schedule reports — set up automated email delivery
- Can manage dashboards — create and configure custom dashboards
- Connect AI Assistants — required for accessing event data via Claude, ChatGPT, or other AI clients
📌 Note: Insights is an Early Access feature and is not enabled by default. Contact support@sessionboard.com to enable it for your account.
FAQ & Troubleshooting
Who can access Insights?
Any team member with the appropriate permissions under Data & Insights in their role configuration. Insights must also be activated for your account — contact support@sessionboard.com if it's not available.
Can I share a report with someone who doesn't have a Sessionboard account?
Yes. Use the Share link feature to generate a public URL. You can optionally add a password, set an expiration date, or limit the number of views. The recipient accesses the live report in their browser with no login required.
My AI-generated query isn't returning the results I expected .What should I do?
Try rephrasing your question with more specific details. For example, instead of "show me speakers," try "show all accepted speakers assigned to sessions in Track A." You can also click Edit SbQL after the AI generates a query to manually refine the logic, or use the Schema Explorer to verify the correct field names.
Can I use Insights data in Google Sheets?
Yes. When creating a share link, copy the Google Sheets Formula (=IMPORTDATA()) and paste it into any Google Sheets cell. The sheet will automatically pull live data from your report and refresh when you reload.
Can I build a dashboard that pulls data from multiple modules?
Yes. Each widget on a dashboard is powered by its own query and can pull from any module (Sessions, Contacts, Evaluations, etc.). You can mix and match modules across widgets in the same dashboard.
What's the difference between a Session Report and a Custom Report?
Session Reports are pre-built templates included with every event — they cover the most common reporting needs and can't be modified. Custom Reports are reports you build and save yourself using the Report Builder; they can be edited, shared, scheduled, and duplicated.
Can scheduled report emails be sent to people outside my organization?
Yes. You can add any email address as a recipient when setting up a schedule — Sessionboard accounts are not required. Recipients receive a secure link that expires after 7 days.
Need help? Contact us at support@sessionboard.com